
Material waste is the quiet line item that eats commercial construction margins. It does not show up in a single invoice. It shows up in MEP clash resolution that happens with a saw and a dumpster instead of a model, in pipe and duct that gets ordered against a 2D takeoff and then sits unused, in trapeze supports that get cut twice because the second trade did not know about the first, and in rework that nobody planned for. On a typical commercial project, between ten and fifteen percent of MEP material ends up wasted, lost, damaged, stolen, or rerouted. Some studies put the number higher. That waste is real money · and it is largely preventable. MEP BIM coordination is the discipline built to recover most of it.
This article walks through exactly how MEP BIM coordination closes those leaks. It covers the six places waste hides on a commercial job, the two BOM workflows that produce very different material outcomes, and a category-by-category matrix showing where the up-to-twenty-percent savings actually come from. The argument is operational, not theoretical. It is built for the contractors, estimators, project executives, and owners who write the cheques and want to know · concretely · whether MEP BIM coordination is worth the line item on their fee schedule.
The short answer is yes, but only if it is done properly. The long answer is what follows. We will look at where the waste comes from, how MEP BIM coordination eliminates each source, what a model-accurate Bill of Materials actually looks like, what prefabrication and spool sheets do for shop yield, how to read the cost savings in BIM across material categories, and what an owner or contractor should ask for when they hire a coordination partner. We will close with the most common questions clients ask Eagle BIM about MEP BIM coordination on commercial work.
If you are new to the topic, two prior Eagle BIM articles set useful context: What Is MEP Coordination explains the discipline-level workflow, and What Is Clash Detection in BIM covers the geometric checking that sits inside it. This article assumes those basics and focuses specifically on the material-waste dimension of MEP BIM coordination.
The Cost of Inefficiency · What Material Waste Really Costs on a Commercial MEP Job
| Material waste on a typical commercial MEP scope runs between 10% and 15% of the as-ordered quantity. The waste shows up as field-cut off-cuts, over-ordering against 2D takeoffs, RFI-stranded stock, rework, and damaged or stolen material left on site. Most of it is recoverable through MEP BIM coordination. |
Before we talk about savings, it helps to be honest about the baseline. On commercial construction sites without strong coordination, ten to fifteen percent of MEP material is wasted. That number is consistent across multiple industry studies and aligns closely with what general contractors and trade partners report internally. On larger jobs · multi-floor commercial, hospitals, mid-rise multifamily, data center white space · the percentage can climb higher when discipline overlap is dense and the schedule pressure is real.
MEP BIM coordination exists to close that gap. But to close it, you have to know where the leaks are. There are six common sources of MEP material waste on commercial jobs, and they are not equally weighted on every project. Some projects bleed mostly on field cuts and off-cuts; others lose more on rework and stranded stock. A good coordination partner identifies which leaks are largest on your specific job and concentrates effort there.
The first source is design conflicts. Two-dimensional drawings hide three-dimensional collisions. Ductwork that fits on a plan view does not fit when the structural beam, the sprinkler main, and the lighting whip share the same plenum. When those conflicts are discovered in the field, material gets cut down, reordered, or rerouted. The original material · sometimes already installed · is wasted. This is where MEP clash resolution during modeling pays its largest dividend, and where MEP BIM coordination produces its earliest measurable savings.
The second source is estimating padding. When estimators take off quantities from 2D drawings, they add a safety margin · typically ten to fifteen percent · to absorb the inevitable errors. That padding becomes the order quantity. The padding ends up as scrap. With a coordinated 3D model, schedules can be exported with much higher confidence, and the padding shrinks. This is one of the clearest places cost savings in BIM becomes visible on a P&L.
The third source is RFI and stop-work loops. When a trade hits a coordination issue in the field, work stops, an RFI goes out, and stock that was pre-cut or pre-bought for that area sits idle while the question is answered. If the answer changes the routing, that stock becomes scrap. A well-run MEP BIM coordination process anticipates those questions before they become RFIs and resolves them in the model when material is still on a shelf, not in a trench.
The fourth and fifth sources are field cuts and rework. Field cuts are unavoidable to a point · even with prefab, some final adjustments happen on site. But uncoordinated field cuts produce dozens of short ends that are too small to use. Rework is worse: ripping out work that was installed correctly to spec but conflicts with a downstream trade. Both of these collapse dramatically under proper commercial BIM workflows.
The sixth source is damage, theft, and site storage losses. Material delivered too early, stored on slab, exposed to weather, dropped by the wrong fork operator, or walked off in the night counts as waste too. Proper MEP BIM coordination enables just-in-time delivery against the install schedule, which means less material on site at any moment · and less to lose. This is one of the quieter wins of MEP BIM coordination that rarely shows up in the headline savings number but compounds over a long construction window.

The big takeaway from this picture is simple: most of the waste lives in places that 2D drawings cannot see. MEP BIM coordination moves the visibility forward · into the model · so the cut decisions, the order quantities, and the trade sequencing all happen against geometry that has already been checked. That single shift is where the up-to-twenty-percent savings starts.
MEP BIM Coordination · How It Eliminates Waste Before Groundbreak
| MEP BIM coordination eliminates waste by resolving conflicts in a federated 3D model before any material is ordered. Clash detection catches geometric conflicts, model-based scheduling produces accurate quantities, and spool sheets drive prefabrication · together cutting waste from a 10–15% baseline down to 2–5% on well-run projects. |
The core mechanism of MEP BIM coordination is straightforward. Disciplines model their work in Revit. Models get federated in Navisworks (or BIM 360 / ACC, or Revizto). The team runs clash detection and works through hard clashes · pipe through beam, duct through wall, conduit through joist. Then they work through soft clashes · clearance, maintenance access, code-mandated separation. By the time fabrication and procurement happen, the geometry has been resolved against real coordinates, not optimistic 2D plans.
On a commercial BIM workflows pattern, MEP BIM coordination happens during design development and continues through construction documents. Each weekly coordination meeting clears a batch of clashes. The federated model becomes the single source of truth for what gets ordered and what gets installed. When changes happen · and they always happen · they propagate through the model first, and the BOM updates with them.
The cost mechanism that drives waste reduction is this: every clash that is resolved in the model is a clash that does not get resolved in the field. A field resolution costs material (the part that has to be cut or reordered), labor (the second installation), and schedule (the time spent waiting). A model resolution costs only the BIM coordinator’s hour. The arithmetic compounds quickly across hundreds of clashes on a typical commercial project, and it is the central reason MEP BIM coordination pays for itself several times over.
The discipline matters too. MEP BIM coordination that ends at clash detection misses most of the savings. The full discipline includes hanger and support coordination, equipment access verification, sleeve and embed coordination with the structural model, and integration with the architectural ceiling grid. Each of those checks pre-empts a different category of field waste. Eagle BIM’s MEP BIM coordination workflow covers all of them as a single pass.
For a deeper look at how this fits together inside the Revit ecosystem, see our Revit MEP Coordination Workflow article. It covers the model-setup, worksharing, and Navisworks federation steps in detail. This article assumes the workflow is in place and focuses on the material-waste outcome that workflow produces.
Accurate Bill of Materials (BOM) Generation
The BOM is where the savings become visible to a CFO. A traditional 2D takeoff produces a BOM that is, in practice, an estimate plus a safety margin. The estimator counts what they can see, adds ten to fifteen percent to cover what they cannot, and that becomes the order quantity. The padding is real material that has to be paid for, stored, and ultimately disposed of. MEP BIM coordination is what removes the reason for the padding in the first place.
A model-based BOM works differently. Quantities are extracted directly from the geometry in the coordinated model. A pipe schedule pulls actual lengths of actual installed runs · not symbolic lines on a plan view. A duct schedule pulls actual fabricated sizes. A conduit schedule pulls the actual routed lengths after coordination, not estimated lengths before. The margin shrinks because the underlying number is more accurate. MEP BIM coordination is the precondition that makes the model accurate enough for the schedule to be trustworthy.
Eagle BIM’s MEP BIM coordination output for a commercial project typically includes Revit schedules tied to coordinated families, exported as Excel workbooks with revision tracking. The schedules separate confirmed quantities (geometry coordinated and reviewed) from pending quantities (still in development). Procurement can order against the confirmed quantities with high confidence and stage the pending ones.
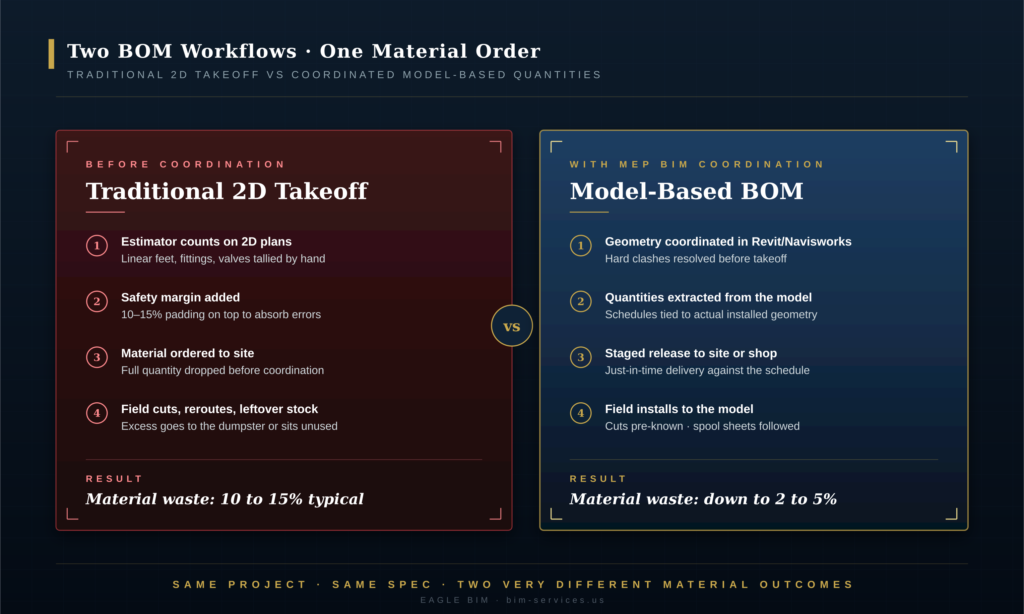
The visible difference is small in the workflow diagram but large in the outcome. A traditional takeoff plus padding produces ten to fifteen percent waste. A coordinated model-based BOM produces two to five percent on a well-run job · and the remaining waste is mostly unavoidable cut yield, not estimating error. The delta is captured material that would otherwise have been ordered and discarded. That is what cost savings in BIM looks like at the procurement line.
Pre-fabrication and Off-site Assembly
Once the geometry is coordinated and the BOM is accurate, the next layer of savings from MEP BIM coordination comes from prefabrication. Pipe spools, duct spools, multi-trade racks, and skid-mounted equipment can be built in a controlled shop environment instead of fabricated on site. Shop fabrication produces tighter cut yields · controlled cuts on a saw with proper measurement, not field cuts with a sawzall on a scaffold.
MEP BIM coordination enables prefab because the coordinated model is what the spool sheets are extracted from. Without coordination, prefab is risky · a shop-built spool that hits a beam in the field is a complete loss. With coordination, the same spool drops into place because the beam coordinates were known when the spool was modeled. This is one of the largest savings categories in the matrix and one of the reasons commercial BIM workflows have become the default on data centers, hospitals, and large multifamily.
The shop-yield advantage from MEP BIM coordination is concrete. A duct fabrication shop running model-driven spools reports significantly less scrap than the same shop running field-measured shops drawings. The material that would have been wasted on site as field off-cuts gets recovered in the shop where short ends can still be used on smaller fittings. The savings show up in the project as fewer dumpsters, fewer reorders, and a faster install.
Eagle BIM works with prefab partners across Texas · DFW, Houston, Austin, San Antonio · and the MEP BIM coordination deliverable for these projects includes spool sheets, fab tickets, and trapeze layouts. The handoff from coordination to fabrication is documented and tied to a single model version, which prevents the most common spool-fab failure: building from a model snapshot that has since changed.
| Want this savings model on your next commercial project?
Eagle BIM runs MEP BIM coordination for commercial, healthcare, multifamily, data center, and semiconductor fab projects across Texas and the broader USA. We deliver clash-resolved models, model-accurate BOMs, spool sheets, and trapeze layouts as a single integrated package. |
Real-World ROI · Tracking the 20% Savings Matrix
| On a coordinated commercial project, the blended material waste reduction lands around 20%. The savings split unevenly across categories · ductwork (20–24%), pipe and fittings (18–22%), sprinkler systems (15–18%), conduit (12–16%), and hangers and supports (22–28%). MEP BIM coordination delivers the largest dividend on ductwork and prefab-friendly trades. |
The single biggest mistake in conversations about cost savings in BIM is treating the savings as a flat percentage. It is not. The MEP BIM coordination savings break down by trade and category, and the breakdown matters because it tells you where to concentrate coordination effort. A project with heavy ductwork (think a large office floor with big AHUs) will see the biggest dividend in the duct category. A project with heavy electrical (think a data center) will see the biggest dividend in conduit, cable tray, and trapeze supports.
The matrix below summarises the MEP BIM coordination savings ranges Eagle BIM has seen across commercial projects in the past several years. The numbers are drawn from contractor case studies and our own coordination project outcomes. They are presented as ranges because they vary with project size, density, schedule pressure, and the maturity of the contractor’s prefab program.

Three numbers from the MEP BIM coordination matrix stand out. Hangers, supports, and inserts deliver the highest percentage savings (22–28%) because combined trapeze supports · designed from the coordinated model to carry multiple trades on one structure · eliminate huge volumes of duplicate hanger material. Ductwork comes second (20–24%) because shop prefabrication concentrates cut yield in a controlled environment. Pipe comes close behind (18–22%) for the same prefab reason.
Electrical conduit (12–16%) is lower because conduit is inherently more flexible · it can be bent and routed in the field with less waste than rigid pipe or sheet metal duct. But even at the lower end, twelve percent is meaningful on a large electrical scope. The cumulative result, blended across all categories, lands close to the headline twenty-percent number. MEP BIM coordination is what unlocks every row in the matrix.
How those MEP BIM coordination numbers compound on a project depends on the mix. A heavy-MEP commercial fit-out (lab, healthcare, hospitality) tilts toward the higher end. A simple office floor tilts toward the middle. A scope-light retrofit might be at the lower end. Eagle BIM’s first conversation with a new client almost always involves mapping their project mix to this matrix and producing a realistic savings estimate · not a marketing number.
The ROI conversation should also include MEP clash resolution outcomes that are not directly material-waste, but show up next to it on the project ledger: schedule recovery, RFI volume, and rework labor. A MEP BIM coordination project typically reports significantly fewer RFIs (one common case-study range is 50–70% fewer field-coordination RFIs) and noticeably less rework labor. Those numbers are not waste percentages in the strict sense, but they sit on the same cost-savings line.
If you want a project-by-project breakdown of how coordination cost compares to material waste savings, our companion article BIM Coordination Cost walks through that math. The summary: on most commercial projects, the coordination fee pays back from material savings alone before you even count the schedule and labor benefits.
MEP BIM Coordination · The Deliverables That Actually Drive Savings
| The deliverables that drive material waste savings from MEP BIM coordination are: a federated and clash-cleared Navisworks model, model-based BOM schedules in Excel, spool sheets and fab tickets for prefab partners, combined trapeze layouts, sleeve and embed coordination drawings, and a versioned clash report. A coordination engagement without these is mostly theatre. |
Not every MEP BIM coordination engagement produces the same outputs, and the variation matters. A coordination engagement that produces only a clash report and a federated NWD file delivers some value · but not the full material-waste savings described above. The full deliverable package is what unlocks the matrix. Owners and contractors hiring a coordination partner should ask explicitly what is in the package.
First, the coordinated federated model. This is the Navisworks NWD (or Revizto / BIM 360 equivalent) that contains all discipline models linked together, with clashes resolved to a defined level. Eagle BIM’s MEP BIM coordination delivers this as a weekly published file during construction documents and as a frozen ‘issued for construction’ file at the milestone. The model is the source for everything downstream.
Second, the BOM schedules. Revit schedules exported as Excel, with separation between confirmed and pending quantities. The schedules cover pipe by size and material, duct by size and gauge, conduit by size and type, sprinkler by main/branch/drop, equipment by tag, hangers and supports by type. The estimator and the procurement team work from these directly. This is where material waste reduction construction becomes a procurement decision instead of a guess.
Third, spool sheets and fab tickets. These are 2D shop drawings extracted from the coordinated model · they are what the fab shop builds from. Each spool has dimensions, fitting callouts, and a tag tied back to the model element. When a shop builds from a spool sheet, the cut yield is high because the dimensions are not estimates.
Fourth, combined trapeze layouts. The single largest savings category in the matrix is hangers and supports, and the reason is the combined trapeze · one structural support carrying duct, pipe, conduit, and cable tray. Designing these requires the coordinated model. Eagle BIM produces trapeze layouts as part of the MEP BIM coordination package, including connection details and tag-back to the structural model.
Fifth, sleeve and embed coordination. Sleeves through walls, slabs, beams, and footings need to be coordinated with the structural model before concrete is poured. Coordination errors here are among the most expensive in construction. MEP BIM coordination catches these in the model so they show up on the structural shop drawings, not as a hammer-and-chisel rework after the slab is poured. This is one of the highest-leverage parts of any MEP BIM coordination scope.
Sixth, a versioned clash report. Each weekly MEP BIM coordination cycle produces a clash report showing what was resolved, what remains open, and who owns each item. The report is the project’s audit trail and the basis for milestone reviews. A coordination partner that cannot produce a clean clash history is operating without a paper trail · and is harder to hold accountable when things slip.
When Does the 20% Savings Actually Show Up?
| The 20% material waste savings from MEP BIM coordination shows up gradually across procurement, fabrication, and installation. The earliest visible savings are in fabrication shops (4–6 weeks into construction). The largest cumulative savings are visible by trade closeout · typically 60–80% complete on the MEP scope. |
One of the more common owner questions on MEP BIM coordination is when exactly the savings materialise. The honest answer: not all at once, and not at the front. The coordination work happens early · during design development and construction documents · and the cost of that work is felt before any material savings are visible. The savings come later, distributed across procurement, fabrication, and installation phases.
The earliest visible savings from MEP BIM coordination show up in fabrication shops, typically four to six weeks after construction starts and the prefab program kicks in. Shop foremen see tighter cut yields, fewer rework cycles, and less scrap going into the bin. This is anecdotal and per-shop, but it is consistent enough that Eagle BIM uses it as a leading indicator that the MEP BIM coordination is producing the expected outcomes.
The next wave of savings shows up in procurement · fewer reorders, fewer change-quantity POs, and lower padding on second-batch orders once estimators see the model-based quantities holding up. This is usually visible by month two or three of construction. The procurement manager is often the first non-BIM person on the project to feel the cost savings in BIM directly.
The largest cumulative MEP BIM coordination savings show up at trade closeout, when each MEP discipline finalises their as-built quantities. The comparison between what was ordered, what was installed, and what was wasted becomes auditable. Projects that ran proper MEP BIM coordination from the start typically close out with waste percentages in the two-to-five-percent range, against the ten-to-fifteen-percent baseline.
One important caveat: late-start coordination produces partial savings. If MEP BIM coordination is added halfway through construction · after design is frozen and material is partially ordered · the achievable savings are smaller, because much of the procurement decisions have already been made. The biggest savings come from coordination that starts during design development, before procurement decisions are locked.
Common Mistakes That Erode the Savings
| The most common mistakes that erode MEP BIM coordination savings are: starting too late, treating coordination as clash detection only, skipping the model-to-BOM step, ignoring trapeze and support coordination, and failing to control model versions used by fab shops. Each of these can cut the achievable savings by half. |
There are five common ways projects undermine the savings that MEP BIM coordination should produce. They are predictable, and they are avoidable. Understanding them up-front is the single most useful thing an owner or contractor can do before signing a MEP BIM coordination contract.
First mistake: starting too late. Coordination that begins after construction documents are issued has less leverage than coordination that begins during design development. The biggest material savings come from procurement decisions made on coordinated geometry · if procurement has already happened, the savings window is partly closed. Recommendation: bring MEP BIM coordination in at design development, not at construction.
Second mistake: treating MEP BIM coordination as clash detection only. A clash-cleared model that does not produce BOM schedules, spool sheets, and trapeze layouts has captured only part of the value. The full MEP BIM coordination deliverable package is what drives the matrix-level savings. Recommendation: write the scope of work to require all six deliverables, not just the clash report.
Third mistake: skipping the model-to-BOM step. Some MEP BIM coordination engagements stop at the federated model and hand off to the trades to do their own takeoffs. That re-introduces the estimating padding the model was supposed to eliminate. Recommendation: insist that the MEP BIM coordination deliverable includes the BOM schedules, and that those schedules are the basis for procurement.
Fourth mistake: ignoring trapeze and support coordination. As the matrix shows, hangers and supports deliver the largest percentage savings of any category. Yet trapeze coordination is often the first scope item cut when fees come under pressure. Recommendation: protect the trapeze coordination scope · it is where the largest unit savings sit.
Fifth mistake: failing to control model versions. The fab shop has to build from a known model version. If the shop is working from an out-of-date model snapshot and the model has since changed, the spools will not fit. Rework happens. The savings evaporate. Recommendation: define a model release cadence (typically weekly) and ensure the fab shops know which version is the build-from version.
MEP BIM Coordination for Different Commercial Project Types
| MEP BIM coordination behaves differently across commercial project types. Data centers and hospitals see the highest absolute savings because MEP density is extreme. Office buildings see moderate savings. Retail and small commercial fit-outs see proportionally smaller savings but still positive ROI. The matrix percentages hold; the dollar amounts scale with scope. |
The savings matrix from the earlier section is a useful starting point, but it is a generic average. Different commercial project types load the matrix differently. A data center’s MEP scope is dominated by electrical, cooling, and structural support; a hospital is dominated by medical gas, complex HVAC, fire-rated penetrations, and patient-room services. The percentages in the matrix are similar, but the absolute material savings from MEP BIM coordination scale with the size and density of each category.
Data centers are at the high end of the savings curve. The electrical conduit and cable tray scope is enormous, the cooling distribution is dense, and the support steel and trapeze count is high. MEP BIM coordination on data centers typically delivers savings closer to the upper edge of the matrix ranges, and the absolute dollar volume is large because the unit material counts are large.
Healthcare projects · hospitals, ambulatory surgery centers, medical office buildings · sit similarly high. The medical gas system, the segregated HVAC zones for infection control, the redundant power distribution, and the fire-rated assembly penetrations create a coordination-heavy environment. Renovations are especially favorable for MEP BIM coordination because field conditions are unknown and clash risk is elevated. Eagle BIM’s healthcare work in DFW and Houston routinely shows the higher end of savings.
Office buildings produce moderate savings · the matrix percentages hold, but the absolute MEP scope is smaller per square foot than data centers or hospitals. The MEP BIM coordination ROI is still strongly positive, especially on Class A high-rise projects with heavy curtain wall and complex air handling. Eagle BIM works on commercial office projects across Austin, San Antonio, and DFW.
Multifamily and mixed-use sit a step lower in MEP density but still benefit substantially. The biggest savings on multifamily come from repeat-unit prefabrication · pre-built bathroom modules, kitchen rough-in racks, and stacked plumbing chases. MEP BIM coordination is the precondition that makes repeat-unit prefab safe. Eagle BIM’s experience on Texas multifamily · covered in detail in our companion article · shows consistent twelve to eighteen percent savings on the MEP scope when the unit-level prefab program is in place.
We covered the Texas multifamily case in depth in our BIM for Texas Multifamily article. The unit-level prefab pattern works as well in commercial as it does in multifamily, with the caveat that commercial spaces are more variable and the repeat-unit dividend is smaller.
Retail and small commercial fit-outs are the lowest end of the scale. The MEP scope is modest, the spaces are usually smaller, and the prefab dividend is limited. The savings percentages from the matrix still hold, but the absolute material savings are smaller. MEP BIM coordination on a small retail fit-out is still positive ROI, but it is less dramatic than on a data center, and the MEP BIM coordination scope can typically be lighter.
How Eagle BIM Delivers MEP BIM Coordination for Material Waste Reduction
| Eagle BIM delivers MEP BIM coordination as an integrated package: federated coordination, model-based BOM, spool sheets, trapeze layouts, sleeve coordination, and a versioned clash report. Engagements typically span design development through trade closeout, with weekly coordination cycles and a fixed model release cadence to fab shops. |
Eagle BIM, in association with BIMPRO LLC, runs MEP BIM coordination from our Pflugerville, Texas office for commercial projects across Texas and the broader United States. Our typical engagement covers the six deliverables described earlier · federated model, BOM schedules, spool sheets, trapeze layouts, sleeve coordination, and the clash report · packaged as a single scope with a single point of accountability.
The MEP BIM coordination engagement structure is straightforward. We come in during design development, work alongside the architect and the design engineers to set up the federated model and coordinate the early discipline drafts, then carry the coordination through construction documents into construction. During construction, we publish a new federated model weekly. Fab shops know that the Monday-morning model is the build-from version for the week.
We work across the major BIM platforms · Revit as the core authoring tool, Navisworks Manage for federation and clash detection, Revizto for issue tracking, BIM 360 / ACC for shared model storage. We also work directly with prefab partners on spool generation in Trimble Fabrication, Stratus, or Procore Fab as the project requires. The MEP BIM coordination software stack is flexible; the deliverable package is consistent.
The MEP BIM coordination team covers the full MEP spectrum: HVAC (sheet metal, hydronic, controls), plumbing (domestic, sanitary, storm, gas), fire protection (wet and dry, foam, clean agent), and electrical (power distribution, lighting, low voltage, fire alarm, security). Many of our clients are general contractors looking to outsource coordination on commercial projects, but we also work directly with owners and design teams who want MEP BIM coordination embedded in the design phase.
Geographically, we are based in Texas but the work travels. Our active project locations include Houston, the DFW metroplex, Austin, San Antonio, and various sites across the broader USA. The MEP BIM coordination workflow does not change with location · what changes is the local AHJ context, which our team coordinates with on each project.
If you want to see the wider Eagle BIM service mix that MEP BIM coordination sits inside, our BIM Coordination Services page covers it. The MEP BIM Services page is specifically focused on MEP scopes.
| Run the savings math on your project.
Send Eagle BIM your project mix · square footage, MEP scope intensity, prefab readiness · and we will map it to the savings matrix and produce a realistic waste-reduction estimate before you sign anything. No marketing math. |
Frequently Asked Questions
These are the questions Eagle BIM hears most often from commercial clients evaluating MEP BIM coordination for the first time. The answers are short and direct.
How much material waste does MEP BIM coordination actually eliminate?
On a typical commercial project, MEP BIM coordination takes material waste from a 10–15% baseline down to a 2–5% range. The blended improvement is around 20% reduction in waste, with the largest savings in ductwork, hangers and supports, and prefab-friendly pipe runs. Exact numbers depend on project size, MEP density, and prefab maturity.
Is the savings number really 20%, or is that marketing?
The 20% figure is a blended average across categories, drawn from contractor case studies and our own project outcomes. Individual categories range from 12% (electrical conduit) to 28% (combined trapeze supports). For a specific project, the realistic estimate is somewhere between 15% and 22% of MEP material cost, depending on scope mix. Anyone quoting a single flat percentage without breaking it down by category is over-simplifying.
When in the project should we start MEP BIM coordination?
Design development is the right starting point. Coordination that begins during construction documents captures most of the savings; coordination that begins after construction has started captures partial savings. Coordination that begins after procurement is largely complete captures very little · most of the decisions that drive waste have already been made by that point.
What happens to the savings if we cut the coordination scope?
It depends on what gets cut. Cutting clash detection eliminates most savings entirely. Cutting BOM extraction loses the procurement-side savings (the largest single component). Cutting trapeze coordination loses the highest-percentage category. Cutting sleeve coordination risks expensive structural rework. The lowest-risk cut is reducing the depth of sleeve and architectural coordination on simpler projects; even that should be done deliberately, not by default.
Do we need our trades to use BIM for this to work?
Ideally yes, but it is not strictly required. The best outcomes happen when each MEP trade is modelling in Revit and contributing to the federated coordination. When trades are not BIM-capable, Eagle BIM can model on their behalf from 2D shop drawings · but that adds cost and reduces the speed of coordination cycles. Most modern commercial trades in Texas are BIM-capable; if yours are not, that is a separate conversation.
How does this compare to clash detection alone?
Clash detection is the geometric checking step. MEP BIM coordination is the broader discipline that includes clash detection plus all the deliverables that translate the coordinated model into procurement and fabrication decisions: BOM schedules, spool sheets, trapeze layouts, sleeve coordination, and version-controlled releases to fab shops. Clash detection without those is mostly a report; the savings come from the full package.
Will the fee for coordination be more than the material savings?
On almost all commercial projects, no. The coordination fee is typically a small percentage of the total MEP material cost; the material savings alone (before schedule and labor benefits) usually exceed the coordination fee by several multiples. The exception is very small fit-outs where the absolute MEP scope is too small for the savings to outweigh a minimum coordination engagement. Eagle BIM is direct about flagging projects where the math does not work.
Does MEP BIM coordination help with schedule too, or just material?
Yes, both. The material savings are easy to count, but coordinated projects also typically report 50–70% fewer field-coordination RFIs, less rework labor, and tighter sequencing between trades. Those benefits do not show up on the material line, but they show up on the schedule and on labor cost. Most owners ultimately value the schedule recovery as much as the material savings.